
2026 U.S. Home &
Small-Space Living Statistics
A source-led snapshot of how U.S. homes are sized, how many bedrooms they contain, how homeowners are renovating, and how selected furnishing prices are changing.
Median floor area of a completed new single-family home
2025
observed · U.S. Census Bureau, 2025 Characteristics of New HousingHouzz respondents reporting a home renovation
2025 activity, reported in 2026
survey · 2026 U.S. Houzz & Home StudyMedian renovation spend among Houzz study renovators
2025 activity, reported in 2026
survey · 2026 U.S. Houzz & Home StudyProjected annual remodeling and repair spending through mid-2027
Projected through 2027 Q2
forecast · Harvard JCHS LIRA, July 23, 2026New homes are not the same thing as the existing housing stock.
The Census Survey of Construction describes newly completed housing. ACS bedroom counts describe a much broader housing-unit universe. We keep those populations separate rather than blending them into one misleading “average home” story.
Median completed new single-family home in 2025
Census also reports 421,000 of 1,005,000 completed new single-family homes had four or more bedrooms. These are Survey of Construction estimates for new construction, not all U.S. homes.
Source: U.S. Census Bureau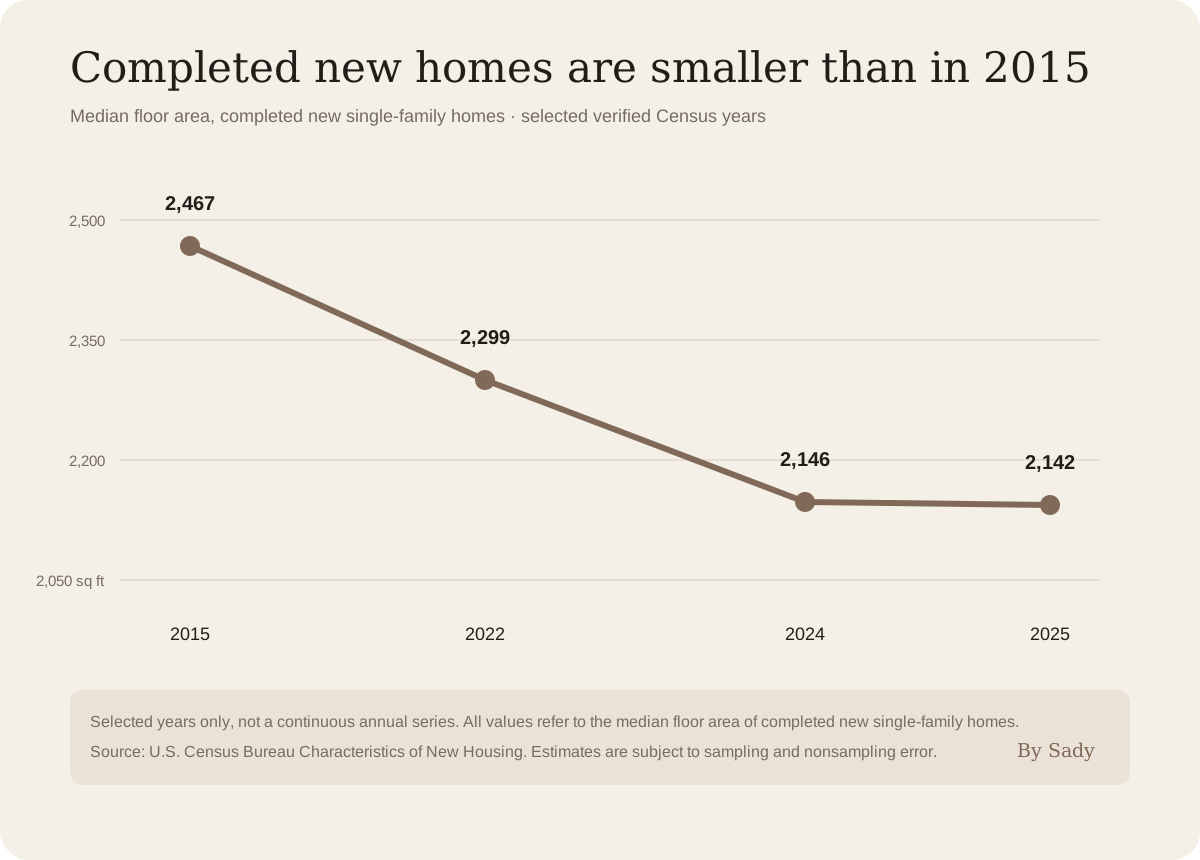
| Year | Median completed new single-family home | Source |
|---|---|---|
| 2015 | 2,467 sq ft | Census |
| 2022 | 2,299 sq ft | Census |
| 2024 | 2,146 sq ft | Census |
| 2025 | 2,142 sq ft | Census |
This is intentionally a selected-year series. We do not interpolate missing annual values or mix in the separate “homes sold” median-size series.
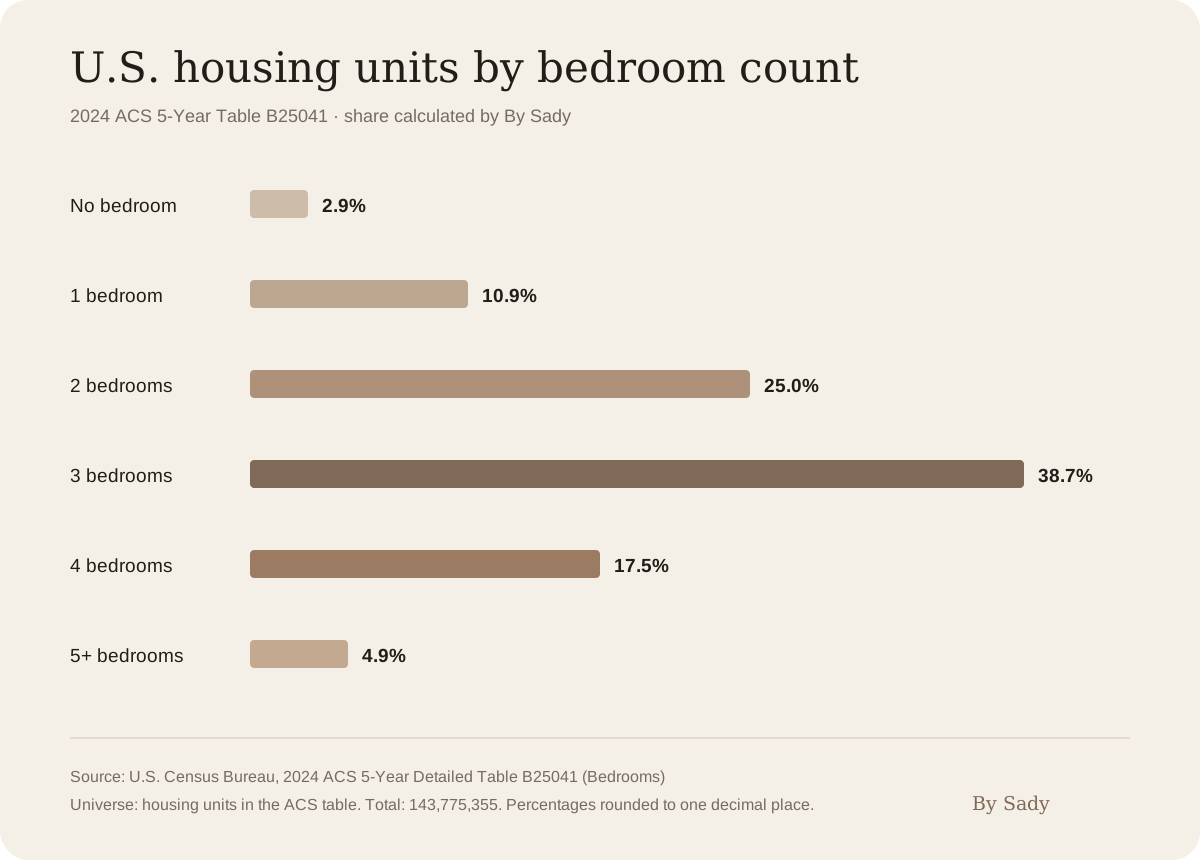
The U.S. housing stock is heavily concentrated in two- and three-bedroom units.
Our shares below are derived directly from 2024 ACS 5-Year Table B25041 counts. The chart is a By Sady calculation; the underlying counts are Census estimates.
| Bedrooms | Housing units | Share |
|---|---|---|
| No bedroom | 4,143,170 | 2.9% |
| 1 bedroom | 15,728,309 | 10.9% |
| 2 bedrooms | 36,004,543 | 25.0% |
| 3 bedrooms | 55,589,936 | 38.7% |
| 4 bedrooms | 25,218,707 | 17.5% |
| 5+ bedrooms | 7,090,690 | 4.9% |
Source: U.S. Census Bureau, 2024 ACS 5-Year Detailed Table B25041. Percentages calculated by By Sady from the published counts and rounded to one decimal place.
Renovation remains common among Houzz’s homeowner audience, but the survey population matters.
Houzz surveyed 20,358 users, including 10,176 renovating U.S. homeowners. These figures describe that study population and should not be presented as if they were Census estimates for every U.S. homeowner.
| Metric | Result | Period | Evidence |
|---|---|---|---|
| Houzz respondents reporting a home renovation | 54% | 2025 activity, reported in 2026 | survey |
| Houzz respondents reporting decorating activity | 52% | 2025 activity, reported in 2026 | survey |
| Median renovation spend among Houzz study renovators | $20,000 | 2025 activity, reported in 2026 | survey |
| 90th-percentile renovation spend in Houzz study | $150,000+ | 2025 activity, reported in 2026 | survey |
| Houzz respondents planning renovation projects | 50% | 2026 plans | survey |
Source: 2026 U.S. Houzz & Home Study, published April 22, 2026.
Spending is projected to remain enormous even as growth slows.
Harvard JCHS’s LIRA is a forecast. It should be described as projected annualized spending on owner-occupied improvements and repairs, not as a final observed total.
Projected by end-2026.
Projected through mid-2027, with year-over-year growth expected to slow to 0.5% in 2027 Q2.
Harvard Joint Center for Housing Studies, July 23, 2026 LIRA.
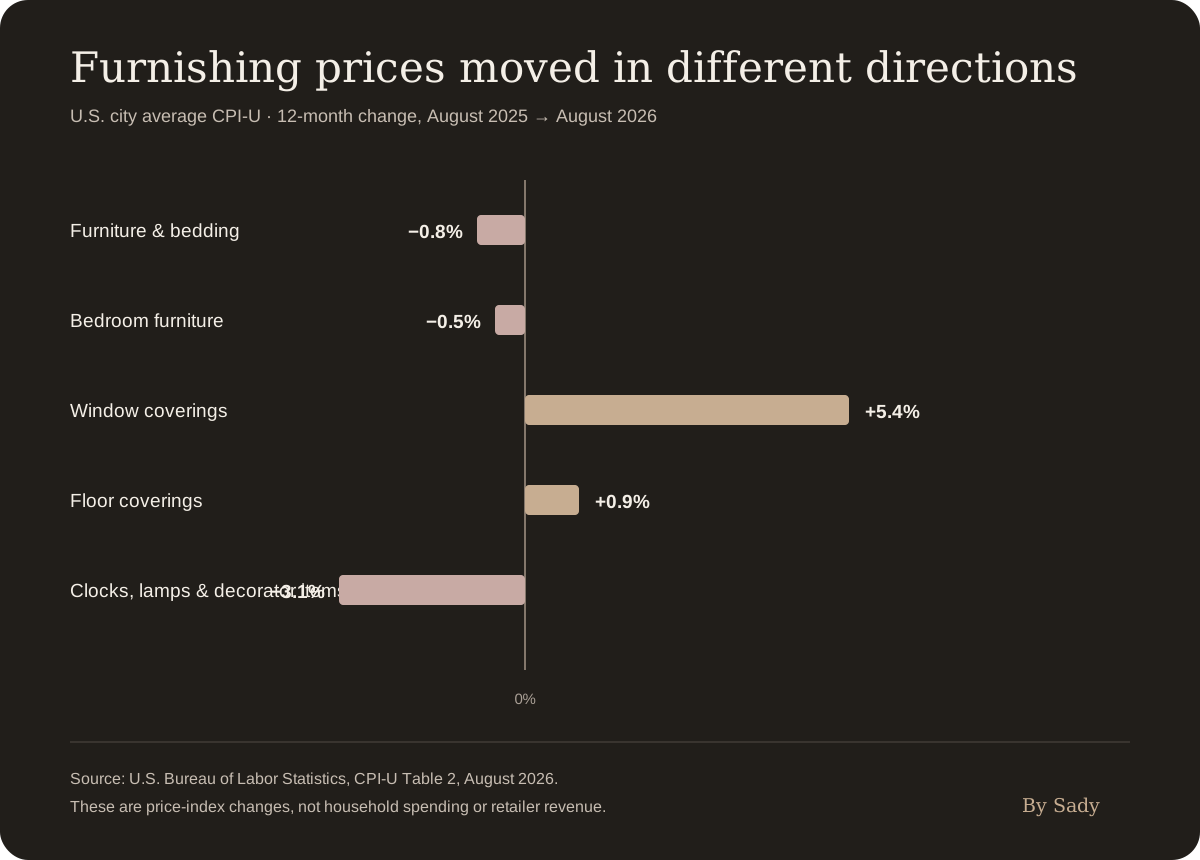
“Home prices are up” is too broad to describe furnishing categories.
BLS’s August 2026 CPI data show different directions across furnishing categories. These are twelve-month price changes, not estimates of what households spent.
| Category | Aug 2025 → Aug 2026 | Measure |
|---|---|---|
| Furniture and bedding | −0.8% | U.S. city average CPI-U |
| Bedroom furniture | −0.5% | U.S. city average CPI-U |
| Window coverings | +5.4% | U.S. city average CPI-U |
| Floor coverings | +0.9% | U.S. city average CPI-U |
| Clocks, lamps and decorator items | −3.1% | U.S. city average CPI-U |
Source: U.S. Bureau of Labor Statistics, CPI-U Table 2, August 2026.
Useful conclusions require keeping unlike populations apart.
The strongest insights here come from reading the datasets together without pretending they measure the same thing.
of ACS housing units have two or three bedrooms.
That makes two- and three-bedroom homes the largest combined part of the bedroom-count distribution in the 2024 ACS table. It says nothing by itself about room dimensions or whether those bedrooms are “small.”
of completed new single-family homes in 2025 had four or more bedrooms.
By comparison, 22.5% of the much broader 2024 ACS housing-unit universe had four or more bedrooms. That contrast is interesting, but it is not a like-for-like trend because one dataset covers new single-family completions and the other covers housing units broadly.
of Houzz’s surveyed homeowner audience reported renovating in 2025.
This supports the idea that improving existing homes remains important among Houzz users. It does not mean 54% of all U.S. homeowners renovated.
furnishing prices moved in different directions.
Window coverings rose 5.4% year over year while furniture and bedding fell 0.8% in the August 2026 CPI table. Budget guidance should therefore be category-specific rather than assuming every home product moved with one inflation rate.
These sources do not establish that Americans are universally moving into smaller homes, that a certain bedroom count causes renovation spending, or that Houzz respondents represent all U.S. households. Those would require different datasets and a different research design.
Every major number traces back to its source.
By Sady calculations are labelled separately. We do not treat survey findings, Census estimates, forecasts and price indexes as interchangeable evidence.
How to cite this research.
The underlying facts remain attributable to their original sources. By Sady’s value here is the structured comparison, derived percentages, charts and interpretation.
By Sady, “2026 U.S. Home & Small-Space Living Statistics,” updated September 21, 2026. Cite the underlying Census, Houzz, JCHS or BLS source when quoting a raw statistic.
Chart reuseYou may reference the By Sady charts with attribution and a link back to this research page. The chart source labels should remain intact so readers can identify the underlying dataset.
What we combine, and what we deliberately do not.
Census SOC and ACS estimates are kept with their stated housing universe and period.
Houzz percentages and spend figures are labelled as results from its study population, not national population estimates.
JCHS LIRA projections remain explicitly forecast values and are never plotted as observed historical totals.
BLS CPI category changes describe price movement, not household expenditure or retailer revenue.
This research page keeps observed estimates, survey results, forecasts and price indexes clearly separated so unlike populations are not presented as one measure.
Turn the numbers into better space decisions.
National housing and renovation figures describe broad patterns. Your own room dimensions determine what actually fits. Start with these practical By Sady planning guides; they are editorial advice, not findings from the underlying datasets.
Find usable storage in a small bedroom
Choose between under-bed, vertical, wardrobe and bedside storage without sacrificing the walking route.
Explore storage decisions → Entryway / Buying guidePick shoe storage that fits the entry
Compare shallow cabinets, racks, benches and baskets by depth, daily access and door clearance.
Compare options → Home office / LayoutPlan a compact working area
Measure desk and chair clearances, lighting and cable paths before selecting new equipment.
Plan the workspace →